For drone operators and surveyors: upload your thermal and RGB imagery and receive a professional survey report β expertly analysed and written up, white-labelled for your business, delivered in 48 hours.
Start a job See a sample reportBuilt for drone operators and surveyors alike β no thermography expertise needed on your side. If you can capture the imagery to our flight guide, we do the rest.
Download the free flight-capture guide for your survey type β altitude, overlap, best time of day β and the on-site readings we need: air & ambient temperature, wind speed, humidity, and flight time.
Drag and drop your paired thermal + RGB JPEGs (radiometric originals, straight from the SD card) with the site details and conditions.
An experienced thermal analyst reviews every frame, cross-references thermal against RGB, runs DTAT temperature quantification, and rates every finding Red / Amber / Green.
A full professional Word/PDF report with your branding β findings register, annotated imagery, spot temperatures, recommended actions β ready to send to your client.
One platform, every inspection type a drone operator gets asked for.
Thermal detection of trapped moisture, ponding zones and saturated insulation, cross-referenced against RGB evidence. Our core specialism.
THERMAL + RGBString-level faults, bypass diode activation, hotspots and shading losses β with DTAT spot-temperature quantification per finding.
THERMAL + RGBVisual condition reporting from RGB imagery β slipped/cracked tiles, flashing, gutters, chimneys, membrane condition β without scaffold or ladders.
RGB ONLYThermal bridging, insulation voids and air leakage on facades and elevations, reported on a balance-of-probability basis.
THERMAL + RGBAerial condition overview for buyers and surveyors β roof, chimneys, and areas a ground-level survey can't see.
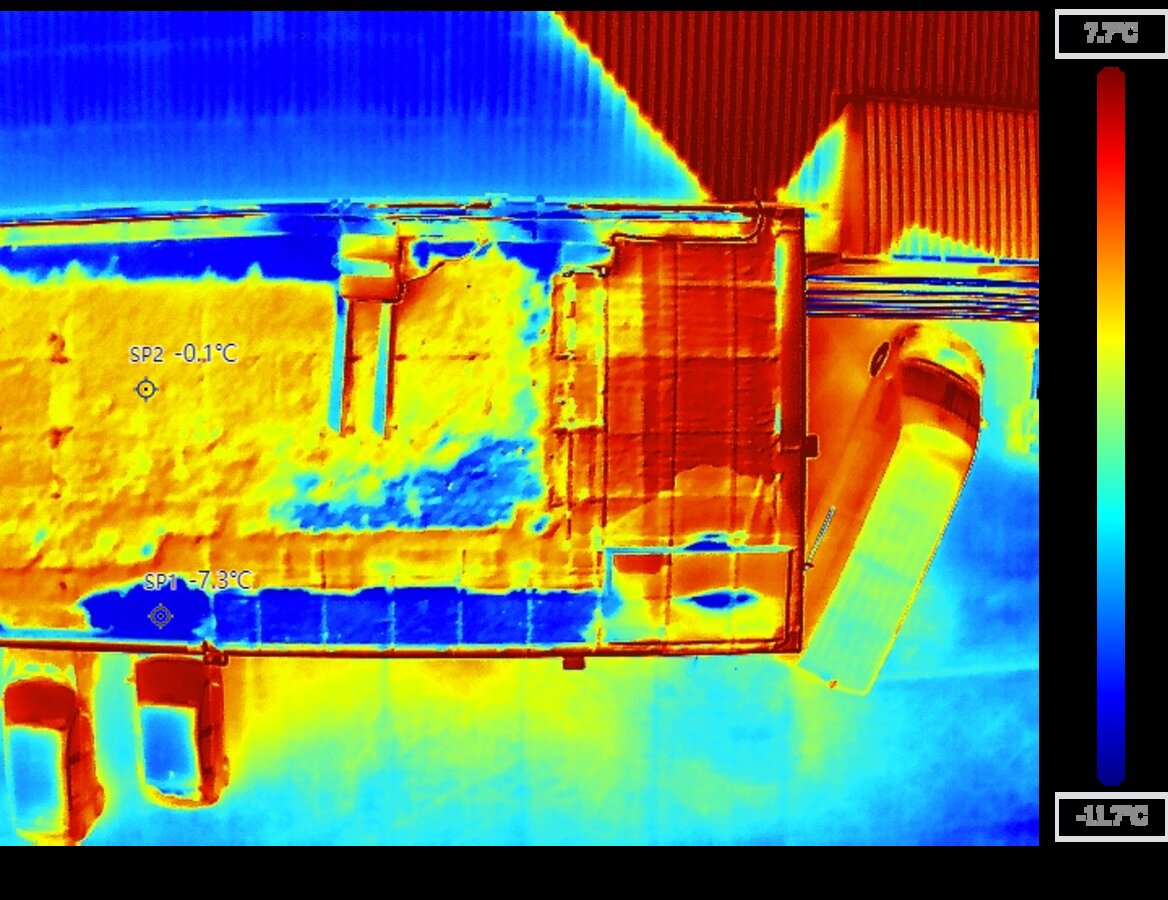
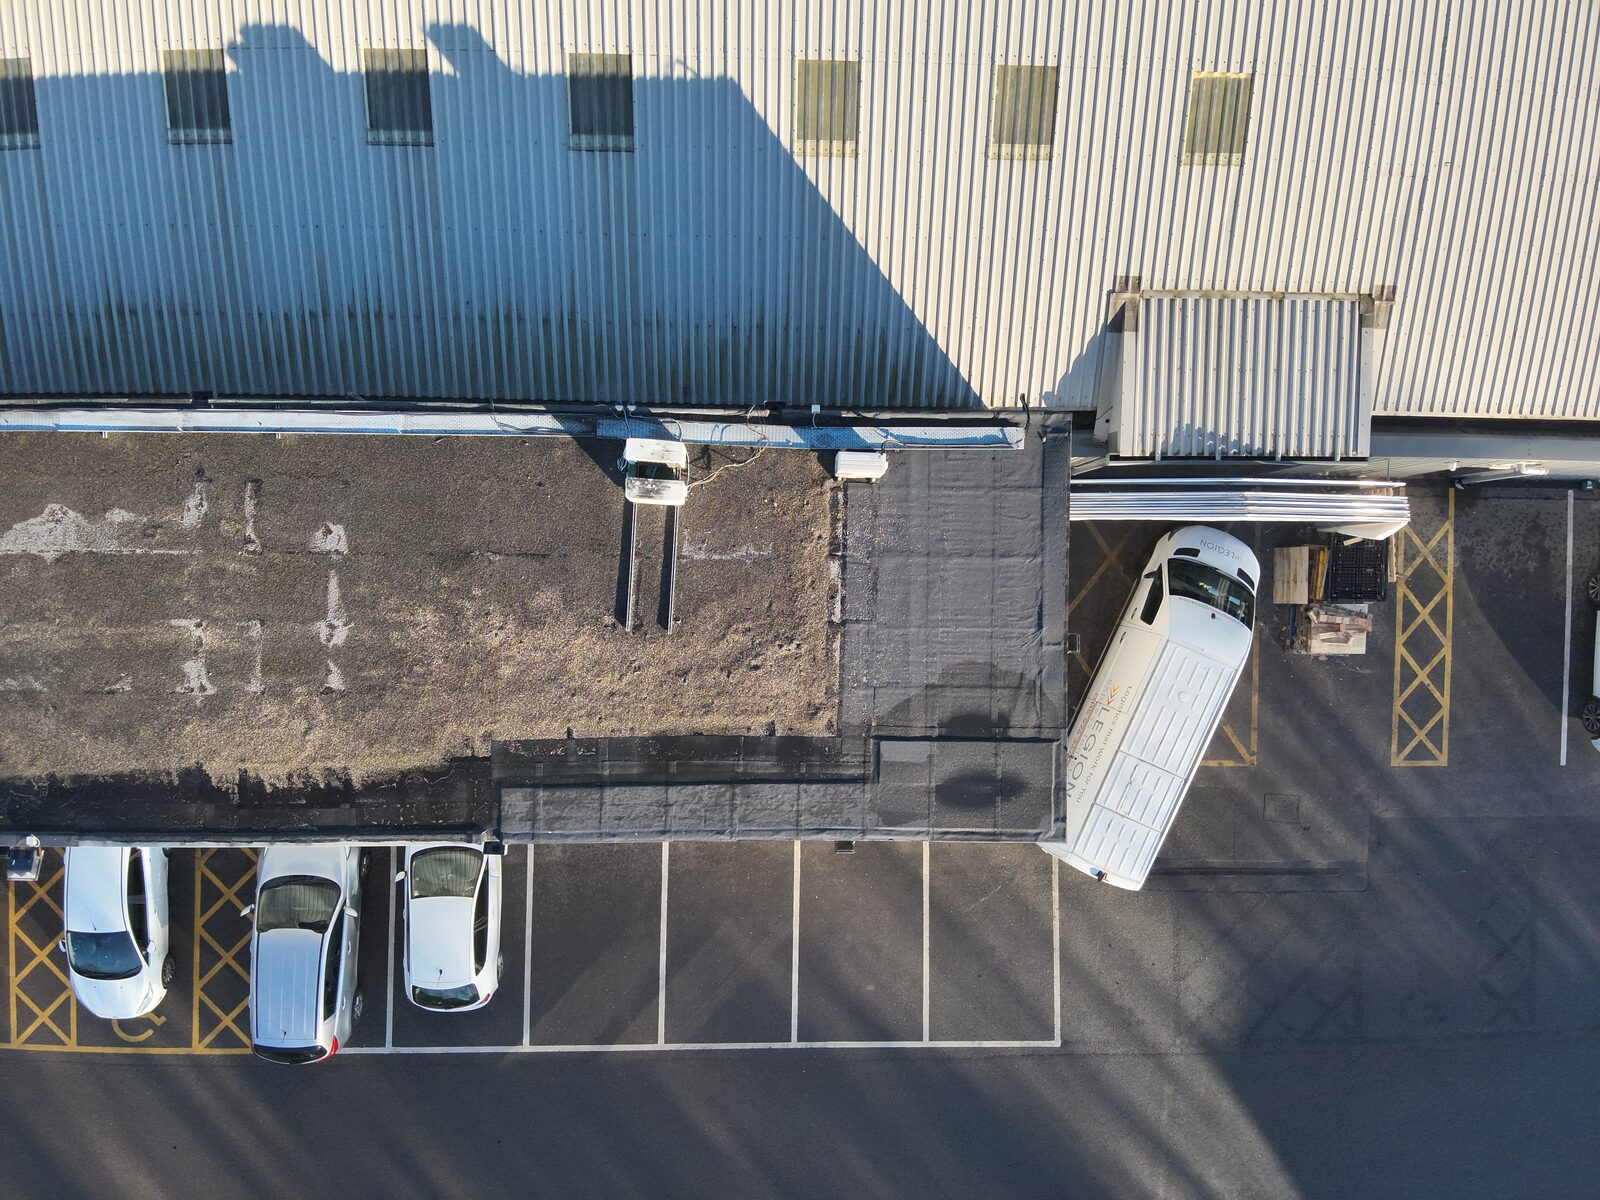
RGB ONLYWarehouses, hangars, cladding and rooftop plant β large-roof surveys reported with a findings register your client can action.
THERMAL + RGBDrones are transforming farm management β but the flight is only half the job. Fly your fields, upload the imagery, and get back counts, condition findings and clear recommendations your farm clients can act on. Built for agricultural drone operators and the farms they serve.
Plant, tree and vine counts from your imagery β orchard inventories, emergence rates by field zone, gap mapping for replanting decisions. Sample-based or whole-block, with the counting method stated in the report.
RGBVisible stress zones, lodging, weed infestation patches, waterlogging and emergence gaps β located, sized, and severity-rated. Specialist diagnosis flagged for agronomist follow-up where needed.
RGB + THERMALThermal finds what the eye can't β stock counts across large or wooded ground, missing animals located, lambing and calving checks without disturbance.
THERMALThermal detection of deer fawns and ground-nesting birds ahead of silage cutting and harvest β documented sweep report for conservation and scheme compliance.
THERMALFailed drains, compaction and persistent wet zones show as thermal and visual patterns β mapped and reported to target remediation before yield suffers.
THERMAL + RGBBarns, grain stores and livestock sheds β roof condition, moisture ingress and rooftop solar performance, reported to the same standard as our commercial work.
THERMAL + RGBFly a standard grid mission, upload the photo set, and receive processed orthomosaics, 3D models and measured volumes with a clear written report. Monthly stock reconciliation for quarries and yards, progress records for construction β recurring deliverables your clients budget for.
Measured volumes per pile with surface model imagery β monthly stock reconciliation for quarries, aggregates yards, waste sites and silage clamps. Same-site repeat flights tracked over time.
RECURRINGScheduled orthomosaic capture over live sites β dated, comparable progress records with change highlighted between visits. Ideal for main contractors and project monitors.
RECURRINGAccurate roof areas, dimensions and pitch from photogrammetry β quote-ready measurements for roofing contractors without scaffold, ladders or site visits.
ONE-OFFOrthomosaics, elevation models and contour outputs for planning, drainage design and estate management. Survey-grade accuracy requirements flagged and scoped per job.
ONE-OFFField boundaries, areas, drainage planning and clamp volumes β a measured base map of the holding that other farm decisions build on.
AGRICULTURETextured 3D meshes of buildings and assets for inspection records, marketing and BIM workflows β delivered in standard shareable formats.
ONE-OFFTell us about the job and we'll come back within two working days with a quote, the flight-capture guide for your survey type, and a secure upload link for your imagery.
Survey type, site address and anything we should know β takes two minutes.
We confirm scope, price and what to capture, with the flight guide for your survey type.
Capture to the guide, then send your paired thermal + RGB JPEGs via the secure upload link we provide.
Your white-labelled Word/PDF report, ready to send to your client.
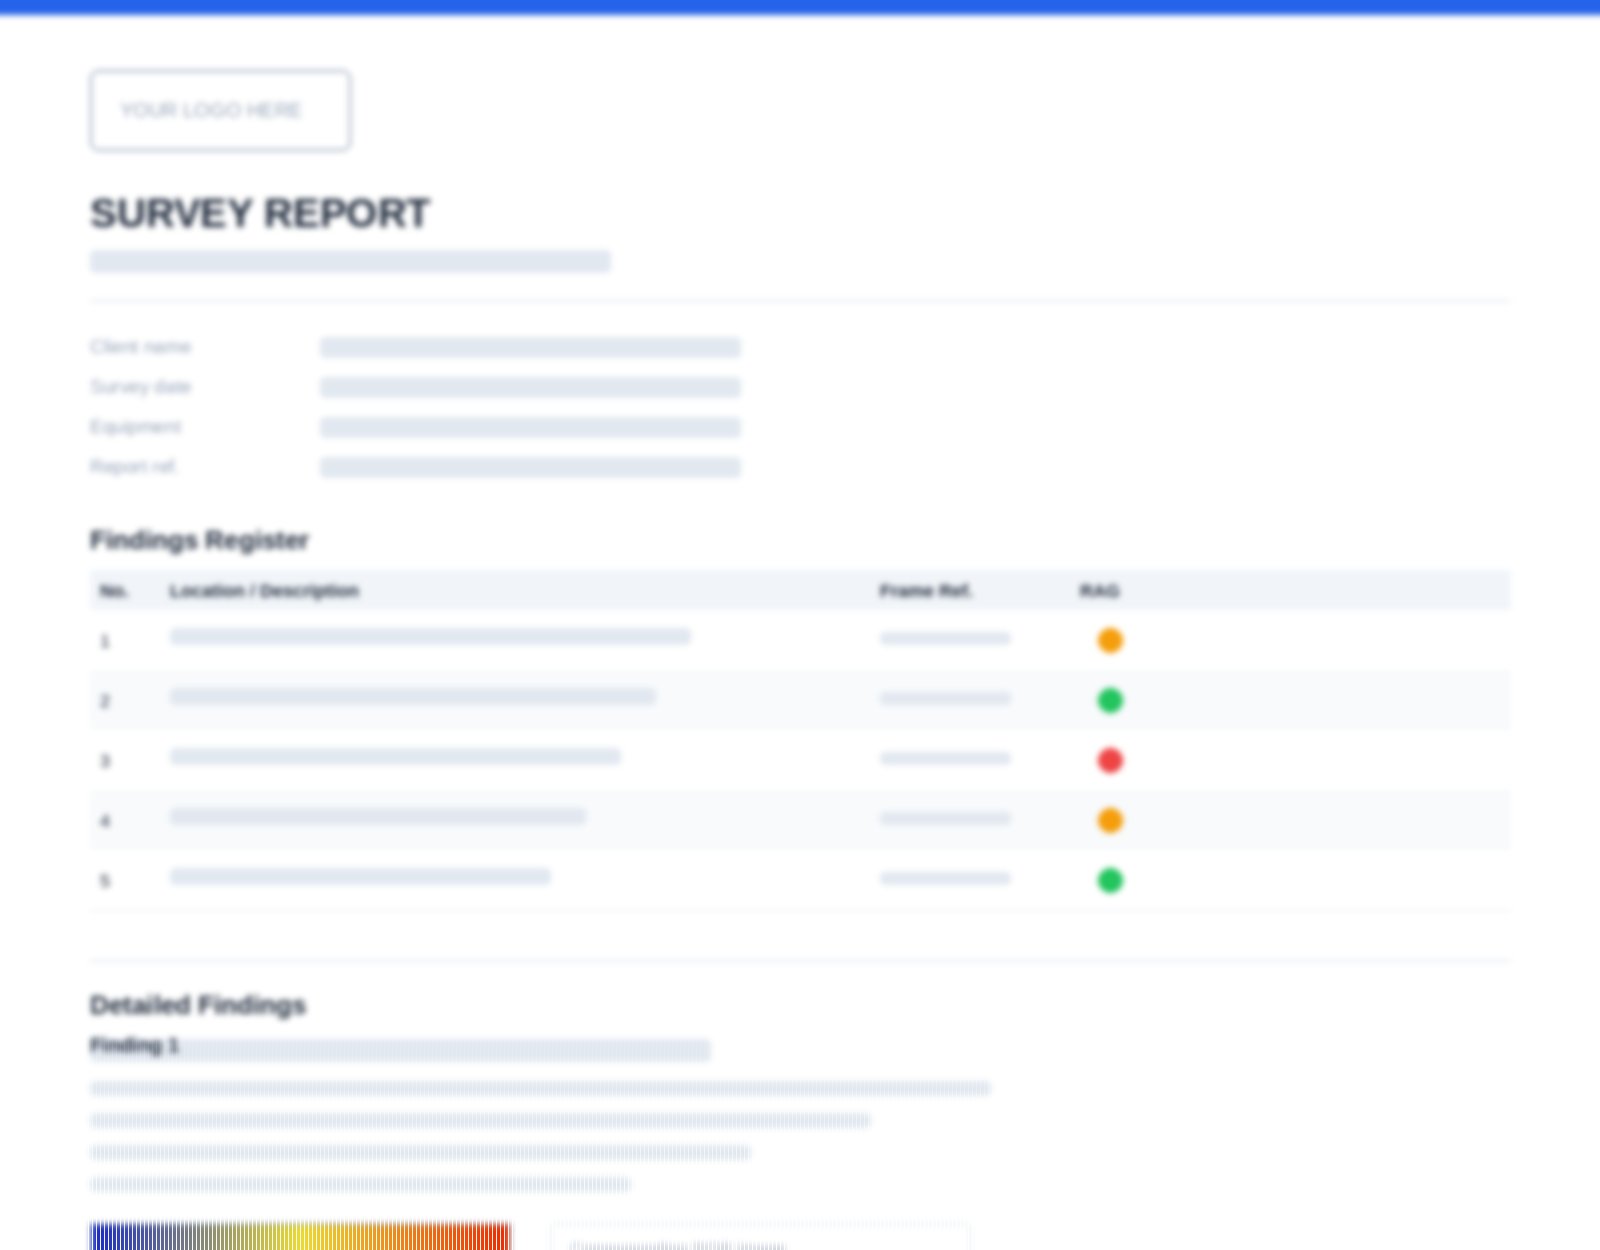
Every report follows the same professional 8-section structure β cover, client details (your branding), survey details, executive summary, methodology, site overview, findings register, and detailed findings with annotated imagery.
Rooftop Solar Photovoltaic Array Survey
Sample Client Ltd β Example Business Park, Anytown AB1 2CD
Survey date: 19 July 2026 Β· Report ref: SR-2026-0142
| Client name | Sample Client Limited (your client β your branding) |
| Client contact | redacted contact |
| Survey time | 15:30 β 15:40 BST |
| Air temperature | 18Β°C |
| Ambient temperature (recorded) | 31.6Β°C |
| Wind speed / direction | 4.0 m/s, north-easterly |
| Relative humidity | 42% |
| Equipment | DJI Mavic 3T, dual thermal and RGB payload |
A drone-based thermal imaging survey of the rooftop solar photovoltaic array was carried out on 19 July 2026. Two findings were identified, both rated Amber. Finding 1 identifies a section-level thermal elevation consistent with a string-level electrical issue; string-level electrical inspection is recommended.
| No. | Location / Description | Frame Ref. | RAG |
| 1 | Array section β section-level thermal elevation | 0006_T | Amber |
| 2 | East column β intra-column string gradient | 0039_T | Amber |
| Panels / area affected | Multiple panel columns; estimated 20β40+ panels |
| Measured temperatures | Warm section 36.4β36.6Β°C; adjacent generating panels 28.5β28.9Β°C |
| Temperature differential | Approximately +8Β°C |
| Severity rating (RAG) | Amber |
Observation: A distinct section of the array shows consistently elevated thermal signatures compared to an immediately adjacent section which reads cool. Both sections appear visually identical in the corresponding RGB imagery β no damage, soiling, or shading.
Probable cause: On balance of probability, a string-level or circuit-level electrical issue causing this section to generate little or no electricity.
Recommended action: String-level electrical inspection, including string open-circuit voltage and current measurement. Priority finding.
Full reports include all 8 sections: Cover Β· Client Details Β· Survey Details Β· Executive Summary Β· Methodology Β· Site Overview Β· Findings Register Β· Detailed Findings Β· Disclaimer. Delivered as Word (.docx) with PDF on request.
Every job is quoted individually β survey type, site size and turnaround all affect the price, so we'd rather give you an accurate number than a headline rate. Send us the job details and you'll have a quote within two working days. Volume and recurring-contract rates available for trade clients.
Get a quote